Media Trend Chart
The Sentiment Analysis Chart in the Media Impact Monitoring dashboard presents a visual representation of media coverage sentiment regarding protest events within a selected time period. This tool aids NGOs in understanding how their protests are perceived in the media, helping them gauge the effectiveness and public impact of their actions.
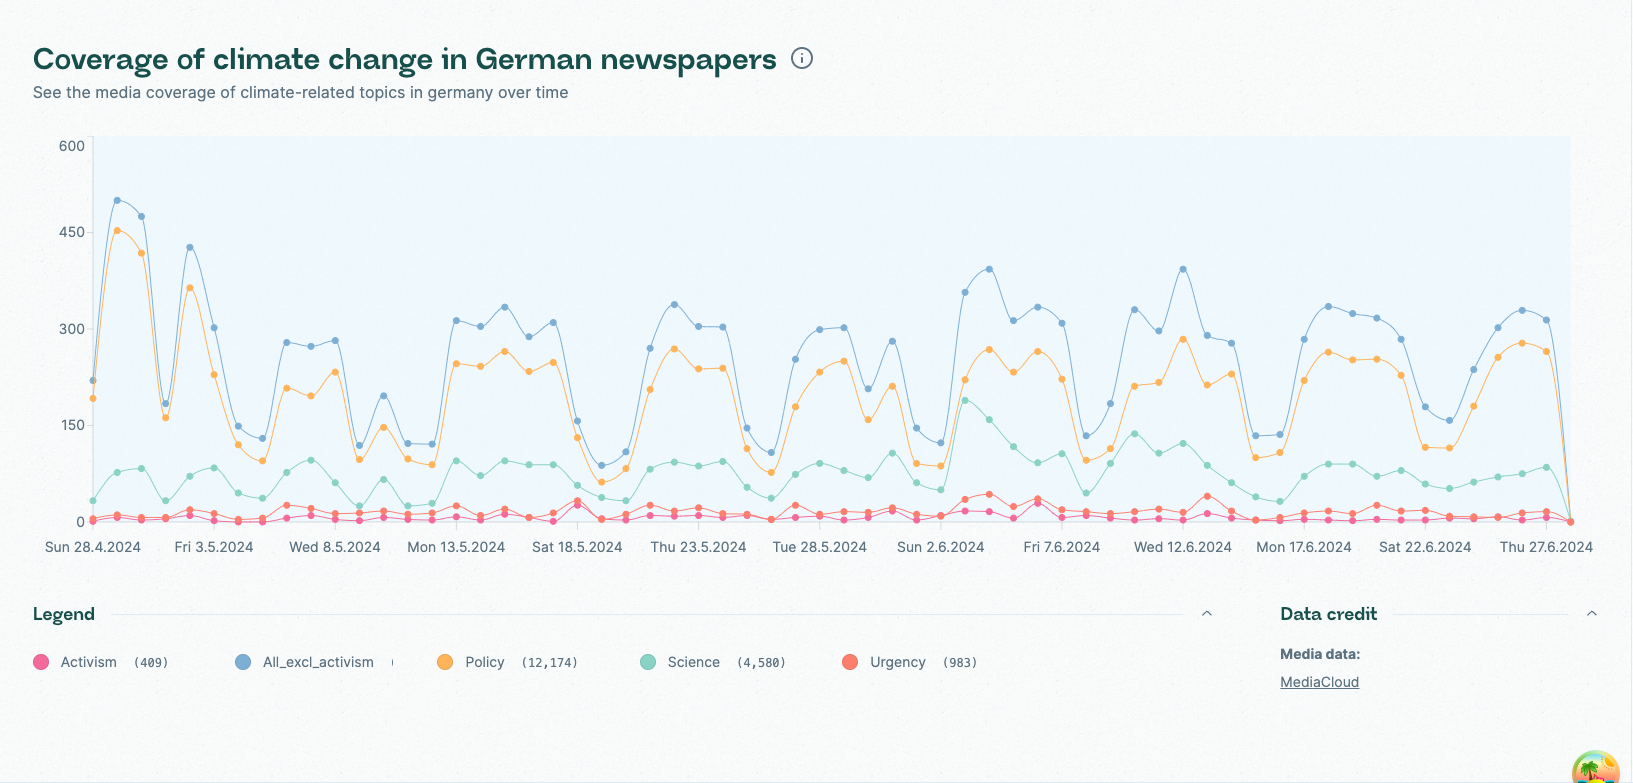
How to read this chart?
The chart aggregates sentiment measurements of articles related to each protest event:
- Positive Sentiment: Indicates favorable media coverage.
- Negative Sentiment: Indicates unfavorable media coverage.
- Neutral Sentiment: Indicates impartial media coverage.
- Trend Lines: Represent the general sentiment trend over time for the chosen period.
To interpret the chart:
- Select the desired time period.
- Observe the average sentiment value for each protest event within this period.
- Pay attention to upward or downward trends in sentiment to understand how media perception changes over time.
Methodology
- Data Collection: Media articles mentioning protest events are gathered.
- Sentiment Analysis: Each article undergoes a sentiment analysis process using natural language processing (NLP) techniques to determine its sentiment score.
- Averaging Sentiment: For each protest event, the sentiment scores of all related articles are averaged to provide an overall sentiment score.
- Visualization: The averaged sentiment scores are plotted on the chart for the selected time period, providing a clear view of media sentiment trends.
The data
Sources
The data used in this chart provides from the following sources:
- Media Cloud
- Genios
- Nexis
- DeReKo (Deutsches Referenzkorpus)
Data processing
- Article Collection: Using web scraping and API integrations, relevant articles are collected.
- Sentiment Analysis: NLP tools analyze the articles to assign sentiment scores. Commonly used libraries and models include VADER (Valence Aware Dictionary and sEntiment Reasoner) and BERT (Bidirectional Encoder Representations from Transformers).
- Averaging: The sentiment scores are averaged for each protest event to represent the overall media sentiment.
Data limitations
- Bias: Media sources may have inherent biases that affect sentiment scores.
- Context: Sentiment analysis tools might misinterpret context, impacting accuracy.
- Coverage: Variability in the amount of coverage across different media platforms can skew results.
Data licensing
The data used in this chart is licensed under the following terms:
 Media CloudData is licensed under the Creative Commons Attribution-NonCommercial-ShareAlike 4.0 International License.
 GeniosData is licensed under the Creative Commons Attribution-NonCommercial-ShareAlike 4.0 International License.
 NexisData is licensed under the Creative Commons Attribution-NonCommercial-ShareAlike 4.0 International License.
 DeReKo (Deutsches Referenzkorpus)Data is licensed under the Creative Commons Attribution-NonCommercial-ShareAlike 4.0 International License.